
Transport significantly contributes to global carbon dioxide (CO2) emissions, accounting for approximately a quarter of the total from energy consumption. In regions with high levels of personal travel, transportation can become a dominant factor in an individual’s carbon footprint. When considering both local and international journeys, understanding the carbon impact of different types of transport is crucial for making environmentally conscious decisions.
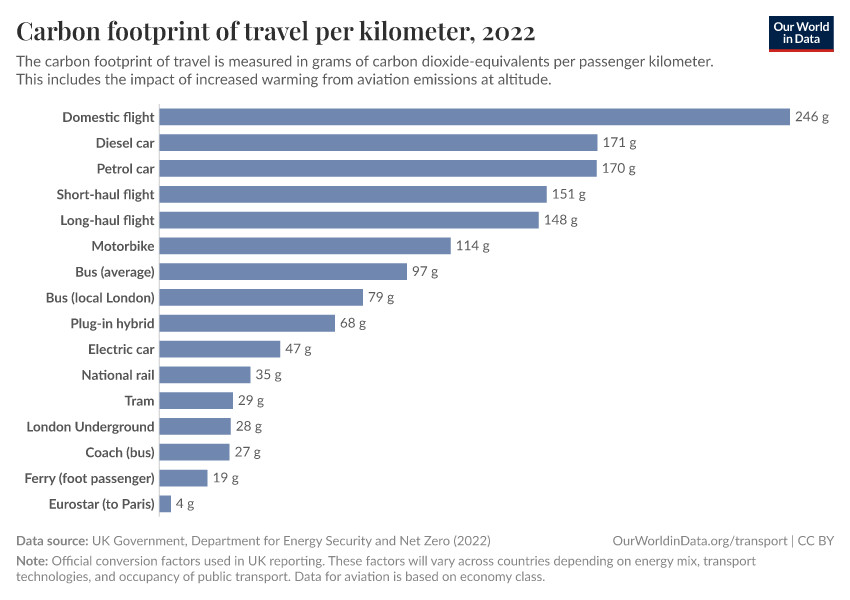
This article examines the carbon footprint associated with various modes of transportation, measured in greenhouse gas emissions per person per kilometer traveled. The data is sourced from the UK Government’s Department for Energy Security and Net Zero, a reliable source utilized by companies for emissions reporting. While specific emission levels can vary across countries due to factors like electricity sources and vehicle fleets, the relative ranking of types of transport remains consistent globally. Greenhouse gas emissions are quantified in carbon dioxide equivalents (CO2eq), which include non-CO2 greenhouse gases and account for the enhanced warming effects of aviation at higher altitudes.
Eco-Friendly Travel: Walking, Cycling, and Trains
For shorter to medium distances, walking and cycling emerge as the most sustainable types of transport, boasting minimal carbon footprints. While not explicitly shown in the chart, cycling typically results in 16 to 50 grams of CO2eq emissions per kilometer, influenced by cycling efficiency and dietary choices. Opting for a bicycle instead of a car for brief commutes can slash travel emissions by roughly 75%.
Public transport, particularly trains, presents another excellent low-carbon alternative. Trains are especially effective for reducing emissions on medium-length journeys, achieving approximately 80% less emissions compared to car travel. For domestic travel, choosing a train over flying can cut emissions by about 86%. Remarkably, taking the Eurostar train in Europe instead of a short flight reduces your carbon footprint by an impressive 97%.
Alternative Types of Transport: EVs, Hybrids, Cars, and Flights
When walking, cycling, or public transport aren’t feasible, what are the next best types of transport?
Electric vehicles (EVs) stand out as the most eco-friendly option for personal transport. They produce fewer emissions than gasoline or diesel cars, even in areas with less-clean electricity grids. The environmental benefits are maximized when EVs are powered by renewable energy sources. It’s important to note that the chart primarily reflects emissions during vehicle operation and doesn’t fully account for manufacturing emissions. Despite concerns about battery production, studies confirm that while EV manufacturing has higher upfront emissions, this is quickly offset by lower operational emissions over the vehicle’s lifespan.
Plug-in hybrid cars represent the next most sustainable option. Beyond these, the choice between a petrol car and flying depends on the travel distance. For distances under 1000 kilometers, flying generates a larger carbon footprint than a medium-sized car. However, for longer journeys, air travel can surprisingly have a slightly lower carbon footprint per kilometer compared to driving alone.
Consider a trip from Edinburgh to London, roughly 500 kilometers. Driving would result in about 85 kilograms of CO2eq emissions. Flying this same distance would increase emissions to 123 kilograms, approximately one-third higher.
Tips for Lower Carbon Travel: Key Takeaways
To minimize your travel carbon footprint, consider these general guidelines when choosing types of transport:
- Prioritize Active Travel: Walk, cycle, or run whenever possible. These options not only reduce emissions but also offer health benefits and decrease local air pollution.
- Embrace Rail Travel: Trains are consistently the most environmentally sound choice for medium to long-distance travel.
- Opt for Ground or Rail for International Travel: For international journeys, trains or boats are preferable to flying due to lower carbon emissions.
- Choose Electric Vehicles: Electric vehicles are almost always cleaner than petrol or diesel cars, especially in regions with greener electricity grids.
- Prefer Driving to Flying for Domestic Travel: For travel within a country, driving, even alone, is generally better than flying in terms of carbon emissions.
- Share Rides: Carpooling significantly reduces your carbon footprint and also helps alleviate traffic congestion and air pollution.
Why Domestic Flights Have Higher Emissions: The Science Behind Flight Carbon Footprints
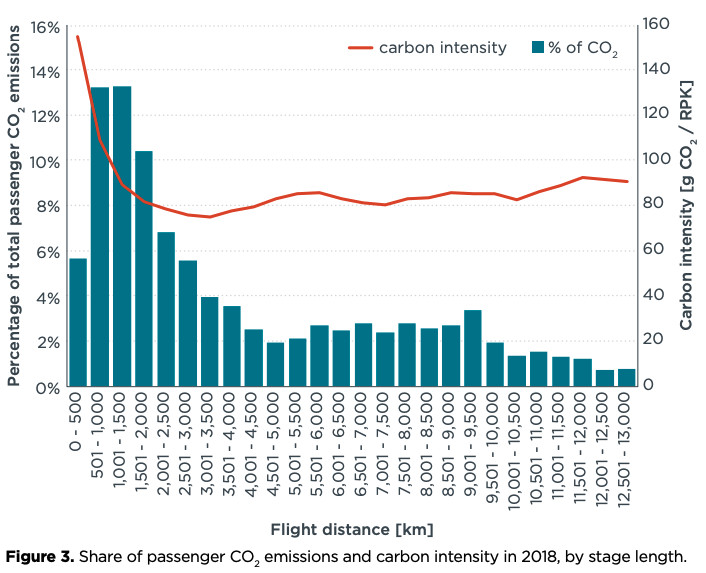
Domestic flights often exhibit a higher carbon footprint per passenger-kilometer compared to both short-haul international and long-haul flights. This phenomenon is explained by the energy demands of flight phases.
Research from the International Council on Clean Transportation highlights that carbon intensity (grams of CO2 emitted per passenger kilometer) is inversely related to flight distance, particularly for shorter flights (under 1,000 km). Carbon intensity decreases significantly as flight distance increases up to around 1,500 to 2,000 km, after which it plateaus.
This is because takeoff requires considerably more energy than the cruising phase of a flight. For short flights, the fuel consumed during takeoff constitutes a larger proportion of the total fuel used, making them less carbon-efficient compared to longer flights with extended cruise phases. Additionally, less fuel-efficient aircraft are often deployed for shorter routes, further contributing to higher emissions per kilometer.
Endnotes
-
The IEA looks at CO2 emissions from energy production alone — in 2018, it reported 33.5 billion tonnes of energy-related CO2 [hence, transport accounted for 8 billion / 33.5 billion = 24% of energy-related emissions.
-
Aviation creates several complex atmospheric reactions at altitude, such as vapor contrails, creating an enhanced warming effect. In the UK’s Greenhouse gas methodology paper, a “multiplier” of 1.9 is applied to aviation emissions to account for this. This is reflected in the CO2eq factors provided in this analysis.
Researchers — David Lee et al. (2020) — estimate that aviation accounts for around 2.5% of global CO2 emissions but 3.5% of radiative forcing/warming due to these altitude effects.
Lee, D. S., Fahey, D. W., Skowron, A., Allen, M. R., Burkhardt, U., Chen, Q., … & Gettelman, A. (2020). The contribution of global aviation to anthropogenic climate forcing for 2000 to 2018. Atmospheric Environment, 117834.
-
Finding a figure for the carbon footprint of cycling seems like it should be straightforward, but it can vary quite a lot. It depends on several factors: what size you are (bigger people tend to burn more energy cycling), how fit you are (fitter people are more efficient), the type of bike you’re pedaling, and what you eat (if you eat a primarily plant-based diet, the emissions are likely to be lower than if you get most of your calories from cheeseburgers and milk). People often also raise the question of whether you actually eat more if you cycle to work rather than drive, i.e., whether those calories are actually ‘additional’ to your normal diet.
Estimates on the footprint of cycling, therefore, vary. Based on the average European diet, some estimates put this figure at around 16 grams CO2e per kilometer. In his book “How bad are bananas: the carbon footprint of everything”, Mike Berners-Lee estimates the footprint based on specific food types. He estimates 25 grams CO2e when powered by bananas, 43 grams CO2e from cereal and cow’s milk, 190 grams CO2e from bacon, or as high as 310 grams CO2e if powered exclusively by cheeseburgers.
-
National rail emits around 35 grams per kilometer. The average petrol car emits 170 grams. So the footprint of taking the train is around 20% of taking a car: [ 35 / 170 * 100 = 20%].
-
National rail emits around 35 grams per kilometer. A domestic flight emits 246 grams. So the footprint of taking the train is around 14% of a flight: [ 35 / 246 * 100 = 14%].
-
Taking the Eurostar emits around 4 grams of CO2 per passenger kilometer, compared to 154 grams from a short-haul flight. So the footprint of Eurostar is around 4% of a flight: [ 4 / 154 * 100 = 3%].
-
The “carbon payback time” for an average driver is around 2 years.
-
An average petrol car emits 170 grams per kilometer. Multiply this by 500, and we get 85,000 grams (85 kilograms).
-
A domestic flight emits 246 grams per kilometer. Multiply this by 500, and we get 123,000 grams (123 kilograms).
-
Graver, B., Zhang, K. & Rutherford, D. (2018). CO2 emissions from commercial aviation, 2018. International Council on Clean Transportation.
Cite this work
Our articles and data visualizations rely on work from many different people and organizations. When citing this article, please also cite the underlying data sources. This article can be cited as:
Hannah Ritchie (2023) - “Which form of transport has the smallest carbon footprint?” Published online at OurWorldinData.org. Retrieved from: 'https://ourworldindata.org/travel-carbon-footprint' [Online Resource]BibTeX citation
@article{owid-travel-carbon-footprint, author = {Hannah Ritchie}, title = {Which form of transport has the smallest carbon footprint?}, journal = {Our World in Data}, year = {2023}, note = {https://ourworldindata.org/travel-carbon-footprint} }Reuse this work freely
All visualizations, data, and code produced by Our World in Data are completely open access under the Creative Commons BY license. You have the permission to use, distribute, and reproduce these in any medium, provided the source and authors are credited.
The data produced by third parties and made available by Our World in Data is subject to the license terms from the original third-party authors. We will always indicate the original source of the data in our documentation, so you should always check the license of any such third-party data before use and redistribution.
All of our charts can be embedded in any site.