
Is there a single mode of transport that stands out as the safest? Absolutely, and at worldtransport.net, we’re dedicated to providing you with thorough insights into transport safety, comparing various options and highlighting the factors that contribute to making some modes safer than others. By exploring statistics, safety measures, and technological advancements, we aim to empower you to make informed decisions for secure travels. Dive in to explore safe travel methods, transportation risks, and safety regulations.
1. What Is The Safest Mode Of Transportation?
Statistically, air travel is the safest mode of transportation. Despite perceptions of danger due to high altitudes and speeds, commercial airlines have an exceptional safety record. Let’s break down what makes flying so safe and compare it to other common forms of transportation.
1.1. Deep Dive into Airplane Safety
Flying remains remarkably safe due to stringent regulations, advanced technology, and highly trained professionals. According to data from the Bureau of Transportation Statistics (BTS), the airline industry invests heavily in safety measures.
- Injury Rates: The average annual injury rate for air travel is strikingly low at just 0.01 injuries per 100 million passenger miles traveled. In comparison, cars and trucks record approximately 48 injuries for the same distance, according to research from the National Safety Council.
- Fatality Rates: From 2002 to 2020, there were zero deaths per 100 million passenger air travel miles each year, as reported by the Federal Aviation Administration (FAA). The average annual fatality rate during this period was a mere 0.01 deaths per 100 million miles traveled.
- Long-Term Safety: According to the International Air Transport Association (IATA), based on 2022 flight fatality data, an individual would need to fly every day for 25,214 years to experience a fatal accident.
The rigorous safety standards implemented by regulatory bodies such as the FAA, combined with continuous advancements in aircraft technology, contribute to air travel’s unparalleled safety record. To further highlight this point, consider that modern aircraft are equipped with sophisticated navigation systems, automated flight controls, and comprehensive maintenance protocols that minimize the risk of accidents.
1.2. Safety Statistics for Air Travel
Delving deeper into the statistical landscape of air travel safety reveals additional layers of assurance. The FAA’s comprehensive data collection and analysis systems allow for continuous monitoring and improvement of safety protocols.
- Accident Rate: The overall accident rate for commercial aviation has steadily decreased over the past few decades. The National Transportation Safety Board (NTSB) reports that the accident rate for U.S. air carriers has fallen to less than one accident per million flight hours.
- Causes of Accidents: When accidents do occur, they are often attributed to a combination of factors, including human error, mechanical failure, and weather conditions. However, even in these cases, the design and operational safeguards in place significantly reduce the likelihood of fatalities.
- Technological Advancements: Continuous technological advancements in aircraft design, navigation systems, and air traffic control contribute to the ongoing enhancement of safety. For example, the implementation of advanced radar systems and GPS-based navigation has greatly improved situational awareness for pilots and air traffic controllers.
1.3 Why Is Air Travel So Safe Compared to Other Modes?
Compared to other modes, flying benefits from a confluence of factors. Stringent regulations, technological advancements, and professional training create a secure environment.
- Stringent Regulations: Aviation undergoes strict oversight by agencies like the FAA, which enforces rigorous maintenance schedules, pilot training, and air traffic control protocols.
- Advanced Technology: Modern aircraft feature advanced navigation, weather forecasting, and automated systems. These technologies mitigate risk.
- Professional Training: Pilots, air traffic controllers, and maintenance personnel receive extensive training, ensuring expertise in handling diverse situations and emergencies.
For more detailed insights and data, worldtransport.net offers a wealth of resources exploring various aspects of air travel safety, from regulatory frameworks to technological innovations.
2. What Are The Other Safer Modes of Transportation?
While air travel takes the crown, several other modes of transportation offer notable safety records. Buses, trains, and boats provide safer alternatives compared to cars and motorcycles.
2.1. Bus Safety: The Overlooked Champion
Buses often go unnoticed in safety discussions, yet they stand as one of the most reliable modes of transport. A blend of regulatory compliance, driver training, and vehicle maintenance bolsters bus safety.
- Regulatory Compliance: The U.S. Department of Transportation (DOT) sets rigorous safety standards, encompassing vehicle maintenance, driver qualifications, and operational protocols.
- Professional Drivers: Bus drivers undergo thorough training, acquiring expertise in defensive driving, passenger management, and emergency response.
- Safety Features: Modern buses incorporate advanced safety features such as anti-lock brakes, stability control systems, and reinforced structures, enhancing passenger protection during transit.
Compared to cars, buses experience significantly fewer accidents per passenger mile. The American Public Transportation Association (APTA) highlights that buses have a lower accident rate than personal vehicles.
2.2. Train Safety: Reliability on Rails
Trains offer a dependable and safe mode of transportation, especially for long-distance travel. Rail transport combines engineering, technology, and operational practices to minimize risks.
- Engineering Standards: Railroad tracks and rolling stock adhere to stringent engineering standards, ensuring structural integrity and operational reliability.
- Signal Systems: Advanced signaling systems regulate train movements, preventing collisions and ensuring safe separation between trains.
- Grade Crossing Safety: Efforts to enhance safety at grade crossings include installing warning devices, improving visibility, and implementing public awareness campaigns.
Despite occasional high-profile accidents, trains maintain an impressive safety record overall. Data from the Federal Railroad Administration (FRA) indicates that train accident rates have steadily decreased over the years due to continuous safety improvements.
2.3. Boat Safety: Navigating the Waters Securely
Boat travel encompasses a wide array of vessels, from recreational boats to commercial passenger ships. Safety measures vary depending on the type of vessel and operational context.
- Passenger Vessels: Ferries, cruise ships, and other passenger vessels adhere to strict safety regulations, including regular inspections, crew training, and emergency preparedness drills.
- Recreational Boating: Safe boating practices, such as wearing life jackets, avoiding alcohol consumption, and monitoring weather conditions, are essential for preventing accidents and fatalities.
- Coast Guard Oversight: The U.S. Coast Guard plays a pivotal role in ensuring maritime safety through regulatory enforcement, search and rescue operations, and boater education programs.
Recent data from the Coast Guard shows that recreational boating accidents often result from operator inattention, excessive speed, and alcohol use. Addressing these factors through boater education and enforcement efforts is crucial for improving safety outcomes.
For additional insights into the safety records of these modes and tips for safe travels, explore the resources at worldtransport.net. We provide detailed analyses and practical advice to enhance your travel experiences.
3. What Is The Most Dangerous Mode Of Transportation?
While we have explored safer options, it’s equally important to understand the risks associated with more dangerous modes of transport. Motorcycles, cars, and private boating present higher risks due to various factors.
3.1. Motorcycle Safety: High Risk on Two Wheels
Motorcycles consistently rank as the most dangerous mode of transportation. Their inherent instability and the rider’s vulnerability contribute to higher accident and fatality rates.
- Accident Statistics: The National Highway Traffic Safety Administration (NHTSA) reports that motorcycles have a significantly higher crash rate per mile traveled compared to cars.
- Vulnerability: Motorcyclists lack the protection of an enclosed vehicle, making them more susceptible to serious injuries in the event of a crash.
- Risk Factors: Factors such as speeding, alcohol impairment, and failure to wear helmets further elevate the risk of motorcycle accidents.
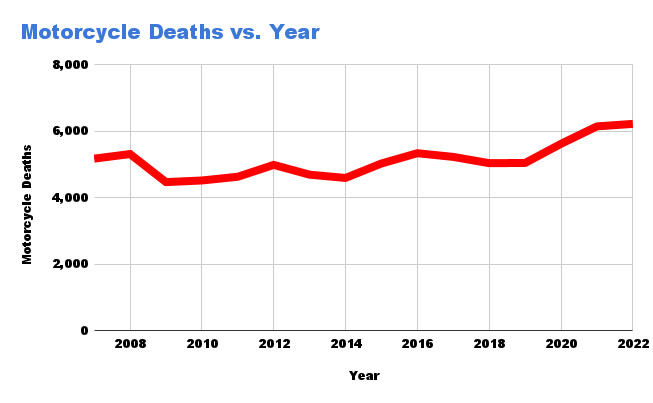
In 2022, there were 6,222 fatal motorcycle crashes, marking the highest number on record and a 23% increase since 2019. For every million miles traveled, there are approximately 213 deaths, around 24 times the car accident fatality rate. Despite motorcycles making up just 3% of registered vehicles, they account for 5% of highway-related fatalities.
3.2. Car Safety: Balancing Convenience with Risk
Cars, while convenient and widely used, carry significant risks due to the sheer volume of traffic and the potential for human error.
- Accident Rates: The Insurance Institute for Highway Safety (IIHS) notes that car accidents remain a leading cause of injury and death in the United States.
- Leading Causes: Distracted driving, speeding, impaired driving, and aggressive driving behaviors contribute to a substantial number of car accidents.
- Safety Features: While modern cars are equipped with advanced safety features, such as airbags and electronic stability control, these technologies cannot eliminate all risks.
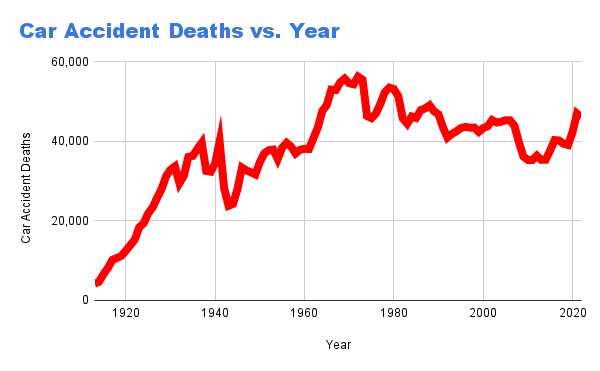
Each year, around six million car accidents occur in the U.S., resulting in an average of 102 fatalities per day. In 2022, there were 42,514 deaths from motor vehicle crashes, with 53% occurring in single-vehicle crashes.
3.3. Boat Safety (Recreational): Risks on the Water
While passenger boats are generally safe, private, recreational boating poses considerable risks.
- Operator Inexperience: Many recreational boat operators lack formal training and experience, increasing the likelihood of accidents.
- Alcohol Use: Alcohol consumption is a significant factor in boating accidents, impairing judgment and reaction time.
- Lack of Safety Equipment: Failure to carry essential safety equipment, such as life jackets and flares, can exacerbate the consequences of boating accidents.
About 5,000 boating fatalities occur in the U.S. each year, or 6.5 deaths per 100,000 registered vessels. Boating fatalities peaked during the COVID-19 pandemic in 2020, with a 25% increase over 2019.
 Motorcycle crash scene, highlighting motorcycle dangers
For detailed statistics, safety tips, and expert analyses on these modes, visit worldtransport.net. We offer resources to help you understand and mitigate these risks.
4. Motorized Transportation Safety Overview
Modern transportation has transformed society, yet this convenience comes at a cost. High speeds and human operation mean that accidents are, unfortunately, a reality.
4.1. Key Statistics on Transportation Accidents
Understanding the broader context of transportation safety involves examining key statistics and trends.
- Preventable Deaths: Motorized transportation accounts for one-in-seven preventable injury-related deaths, according to the National Safety Council.
- Economic Impact: The economic cost of transportation accidents is substantial, including medical expenses, property damage, and lost productivity.
- Demographic Factors: Certain demographic groups, such as young drivers and older adults, are disproportionately affected by transportation accidents.
4.2. Factors Contributing to Accidents
Numerous factors contribute to transportation accidents, including human error, vehicle defects, and environmental conditions.
- Human Error: Driver fatigue, distraction, and impairment are major contributors to accidents across all modes of transportation.
- Vehicle Maintenance: Neglecting vehicle maintenance, such as failing to address worn tires or faulty brakes, can increase the risk of accidents.
- Road Conditions: Poor road conditions, such as potholes and inadequate signage, can compromise safety, especially for motorcycles and cars.
4.3 Technological Advancements
The integration of modern technology has dramatically increased the safety of transport. Collision avoidance systems, automated emergency braking, and lane departure warnings significantly reduce the likelihood of accidents.
- Electronic Stability Control: Prevents skidding and loss of control.
- Adaptive Cruise Control: Maintains a safe following distance.
- Blind Spot Monitoring: Alerts drivers to vehicles in blind spots.
Continuous innovation in transportation safety, combined with proactive measures to address human factors and infrastructure challenges, are essential for reducing accidents and improving overall safety outcomes.
5. Texas Transportation Safety Overview
Texas, with its vast roadways and bustling cities, presents a unique transportation landscape. Examining state-specific data provides valuable insights into local safety trends and challenges.
5.1. Key Texas Transportation Statistics
The Texas Department of Transportation (TxDOT) collects comprehensive data on motor vehicle crashes, providing insights into traffic fatalities, injuries, and accident causes.
- Vehicle Miles Traveled: The annual vehicle miles traveled in Texas during 2023 reached 294.785 billion, reflecting the state’s extensive road network and high travel volume.
- Fatality Rate: The fatality rate on Texas roadways was 1.45 deaths per hundred million vehicle miles traveled, a decrease of 2.81% from the previous year.
- Helmet Use: Helmet use plays a significant role in improving Texas motorcycle safety. In 2023, 40% of motorcyclists killed were not wearing helmets at the time of the crash.
- Bus Safety: Buses are a significantly safer mode of transportation in Texas. In 2023, Texas crash data reported just 18 fatal injury crashes involving buses, compared to 1,943 fatal passenger vehicle accidents and 610 fatal motorcycle accidents.
5.2. Factors Influencing Texas Safety
Several factors influence transportation safety in Texas, including population growth, infrastructure development, and regulatory enforcement.
- Urbanization: Rapid urbanization in Texas has led to increased traffic congestion, contributing to higher accident rates in metropolitan areas.
- Infrastructure Improvements: TxDOT invests in infrastructure improvements, such as highway expansions and safety enhancements, to mitigate congestion and reduce accidents.
- Enforcement Efforts: Law enforcement agencies in Texas conduct targeted enforcement campaigns to address speeding, impaired driving, and other traffic violations.
5.3. Initiatives for Improving Safety
Texas implements various initiatives to enhance transportation safety, including public awareness campaigns, driver education programs, and technological advancements.
- Drive Safe Texas: TxDOT’s “Drive Safe Texas” campaign promotes safe driving practices, such as buckling up, avoiding distractions, and driving sober.
- Driver Education: Texas offers comprehensive driver education programs for new drivers, emphasizing defensive driving techniques and traffic laws.
- Technology Integration: Texas integrates technology, such as intelligent transportation systems and connected vehicle technologies, to improve traffic flow and enhance safety.
 Texas road sign, emphasizing state-specific safety measures
For additional information on Texas transportation safety initiatives and data, visit worldtransport.net. We provide up-to-date information and resources to help you stay safe on Texas roads.
6. Car Safety: What Makes Cars So Risky?
Cars, as a widely used mode of transport, come with substantial risks. Understanding these risks helps drivers make informed decisions and take necessary precautions.
6.1 Accident Statistics
The sheer volume of cars on the road contributes to significant accident statistics. According to data from the IIHS:
- Annual Accidents: Six million car accidents occur in the U.S. each year.
- Daily Fatalities: An average of 102 fatalities occur each day due to car accidents.
- Fatality Rates: One driver fatality occurs every 114 accidents, and one passenger fatality occurs every 654 accidents.
- Injuries: Over five million car accident injuries occur each year.
- Total Deaths: 42,514 deaths resulted from motor vehicle crashes in the United States in 2022.
- Single-Vehicle Crashes: 53% of motor vehicle crash deaths in 2022 occurred in single-vehicle crashes.
6.2 Factors Contributing to Car Accidents
Several factors contribute to the high number of car accidents. These include:
- Distracted Driving: Activities such as texting, talking on the phone, and adjusting the radio divert attention from driving.
- Speeding: Exceeding speed limits reduces reaction time and increases the severity of accidents.
- Impaired Driving: Driving under the influence of alcohol or drugs significantly impairs judgment and coordination.
- Aggressive Driving: Behaviors such as tailgating, weaving through traffic, and running red lights increase the risk of accidents.
6.3 Strategies for Improving Car Safety
Despite the risks, several strategies can improve car safety and reduce the likelihood of accidents:
- Defensive Driving Techniques: Anticipating potential hazards and reacting proactively can help avoid accidents.
- Vehicle Maintenance: Regular maintenance ensures that vehicles are in good working condition.
- Advanced Safety Features: Using safety features such as anti-lock brakes, electronic stability control, and lane departure warning systems can reduce the risk of accidents.
7. Boat Safety: Distinguishing Between Passenger and Recreational Risks
Boat travel varies significantly in safety depending on whether it involves passenger vessels or recreational boats.
7.1 Passenger Vessel Safety
Passenger boats such as cruise ships and ferries are generally safer due to stringent regulations and safety measures.
- Regulatory Oversight: Passenger vessels are subject to strict regulations enforced by maritime authorities.
- Crew Training: Crew members receive extensive training in safety procedures and emergency response.
- Safety Equipment: Passenger vessels are equipped with a wide range of safety equipment, including lifeboats, life jackets, and fire suppression systems.
7.2 Recreational Boating Risks
Recreational boating poses greater risks due to operator inexperience, alcohol use, and lack of safety equipment.
- Operator Inexperience: Many recreational boat operators lack formal training.
- Alcohol Use: Alcohol consumption is a significant factor in boating accidents.
- Lack of Equipment: Failure to carry essential safety equipment can increase the severity of accidents.
7.3 Promoting Safe Boating Practices
Promoting safe boating practices is essential for reducing accidents. These include:
- Boater Education: Encouraging boat operators to complete boating safety courses.
- Life Jacket Use: Emphasizing the importance of wearing life jackets at all times.
- Sobriety: Discouraging alcohol consumption while operating a boat.
- Weather Awareness: Monitoring weather conditions and avoiding boating in hazardous weather.
8. Train Safety: Addressing Perceptions vs. Reality
Trains offer a safe mode of transportation, but accidents can create a false impression of risk.
8.1 Accident Statistics
Despite occasional high-profile accidents, trains maintain a low accident rate. Key statistics include:
- Derailments: There is an average of 1,689 train derailments per year.
- Derailment Fatalities: Between 1990 and 2022, 132 people died in train derailments – about 4 train derailment deaths per year.
- Crossing Accidents: The vast majority of train injuries and fatalities occur at crossings.
8.2 Factors Contributing to Train Accidents
Several factors can contribute to train accidents:
- Track Defects: Poor track maintenance can lead to derailments.
- Equipment Failures: Mechanical failures can cause accidents.
- Human Error: Errors by train operators or crossing users can result in collisions.
8.3 Strategies for Improving Train Safety
Several strategies can improve train safety:
- Track Maintenance: Regular track inspections and maintenance are essential for preventing derailments.
- Signal Systems: Advanced signal systems can prevent collisions.
- Crossing Safety: Improving safety at grade crossings reduces the risk of accidents.
9. Bus Safety: Understanding Why Buses Are So Safe
Buses are one of the safest forms of transportation due to a combination of factors.
9.1 Key Safety Statistics
Buses have a low accident rate compared to other modes of transport. Key statistics include:
- Accident Rates: Buses comprise less than 10% of annual traffic fatalities in the United States.
- Fatal Accidents: There were 15,033 bus accidents in 2022, with 219 being fatal.
- Injury Accidents: Out of the 15,033 accidents, 7,119 resulted in an injury.
- Fatality Percentage: In 2022, 1.5% of bus accidents resulted in a fatality.
9.2 Factors Contributing to Bus Safety
Several factors contribute to bus safety:
- Driver Training: Bus drivers undergo thorough training.
- Vehicle Maintenance: Buses are subject to regular maintenance checks.
- Regulations: Strict regulations govern bus operations.
9.3 Top States for Bus Accidents
Certain states have a higher incidence of bus accidents. The top 5 states with the most bus accidents are:
- New York
- Florida
- Texas
- California
- Illinois
10. FAQs: Addressing Common Concerns About Transportation Safety
10.1. Which mode of transportation has the lowest fatality rate per mile traveled?
Air travel has the lowest fatality rate per mile traveled due to stringent safety regulations and advanced technology.
10.2. Are school buses safer than passenger cars?
Yes, school buses are generally safer than passenger cars due to their size, construction, and safety regulations.
10.3. What are the main causes of car accidents in the United States?
The main causes include distracted driving, speeding, impaired driving, and aggressive driving.
10.4. How can I improve my safety while riding a motorcycle?
Always wear a helmet, take a motorcycle safety course, and avoid riding under the influence of alcohol or drugs.
10.5. What safety measures are in place for commercial airplanes?
These include regular maintenance checks, pilot training, air traffic control systems, and advanced navigation technology.
10.6. Is it safer to travel by train or by car?
Generally, it is safer to travel by train due to lower accident rates compared to cars.
10.7. What should I do if I’m involved in a transportation accident?
Seek medical attention, report the accident to the authorities, and consult with a qualified attorney.
10.8. How does technology improve transportation safety?
Technology such as electronic stability control, adaptive cruise control, and blind-spot monitoring enhances safety.
10.9. What role does infrastructure play in transportation safety?
Well-maintained roads, clear signage, and safe grade crossings contribute to transportation safety.
10.10. What are the best practices for boating safety?
Always wear a life jacket, avoid alcohol consumption, monitor weather conditions, and ensure the boat is properly maintained.
Understanding the safest and most dangerous modes of transportation empowers you to make informed travel decisions. At worldtransport.net, we are committed to providing you with comprehensive information and resources to ensure your safety on the road, in the air, on the rails, and on the water. Explore our articles, data, and expert analyses to enhance your knowledge and make safer choices.
Ready to dive deeper into transportation trends and expert solutions? Visit worldtransport.net today to explore our extensive collection of articles, case studies, and innovative strategies. Contact us at 200 E Randolph St, Chicago, IL 60601, United States, or call +1 (312) 742-2000. Let us help you navigate the future of transportation safely and efficiently.